


Business Process
Automation Consultants

Make Better Decisions Faster with Smartsheet Dashboards

Smartsheet Dashboards – help you surface the right data to make informed decisions faster with Smartsheet
Gain Visibility Into Real-Time Information
Dashboards are designed to give you and your stakeholders real-time visibility into work progress. Since your work is unique, you don’t need to conform to pre-built dashboards. You can fully customize your dashboards through simple, easy-to-use widgets that look great on desktop or mobile, without needing any help from IT or having to learn how to code.
At Smarter Business Processes our Smarter Dashboards can help you to connect with your databases in real time to ensure data integrity. Plus they can tailor reports and report views for individual project groups or teams. This ensures that reporting is data integrity is better and reporting is faster with Smartsheet.
How can I make reports faster with Smartsheet?
Widgets can pull real-time data from where you store and track information. Are you tracking projects in a sheet? Add a link to the sheet or an icon that links back to a sheet. Just want to show select data points from a sheet? Use the metric widget to show information from individual cells.
Need to embed a report showing the latest status across initiatives? There’s no need to do extra work — simply add the report widget. You can also add rich text, titles, attach files, and display images to give others the context they need to understand your information. This makes reports faster with Smartsheet.
The best part is that once you build your dashboard, it’s always up-to-date. You don’t need to constantly maintain it or manually enter the latest metrics into your dashboard, since your widgets are pulling directly from your data sources.
Reports made faster with Smartsheet
The beauty of using Smartsheet is the ease with which you can delivery tailored reports, in sync with organisational databases, in real time to project teams.
Whether you need to view data in real time to make informed decisions, or you need to review and input when on site and off line, for speedy data entry, Smartsheet will enable you to keep up to date and gather information in sync.
Visualize Data With Charts to Make Decisions Faster with Smartshe
Visual representations of data can help you cut through the noise and quickly spot trends in your business. That’s why we’re giving you the ability to chart your Smartsheet data in our new dashboards. Using a simple widget, you can select from four familiar chart types: bar, column, line and pie.
These charts pull real-time data from sheets, so you can analyze progress at a glance and quickly take action.
Dashboards Work for Everyone
Whether you’re a CIO in need of executive-level insights, a sales manager looking to share pipeline activities, or a program manager wanting to share high-level status information, Smarter Dashboards are designed for you.
CIOs who use dashboards always know the health of their portfolio. They get accurate, real-time views of their entire portfolio. They can compare current spend on strategic objectives, track budget vs. actuals, see project status, and more — all in one place. It can be smarter and faster with Smartsheet.

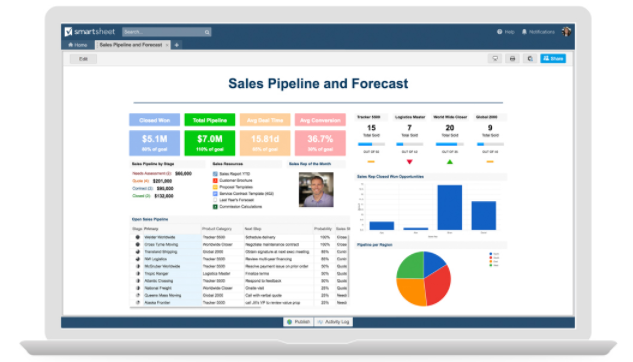
Sales managers who use dashboards know exactly what their pipeline looks like. They can easily move from high-level overviews into the details. Pipeline activity, deal status, and key metrics are never more than a click away. And so reporting is more timely and more convenient because it is always faster with Smartsheet.
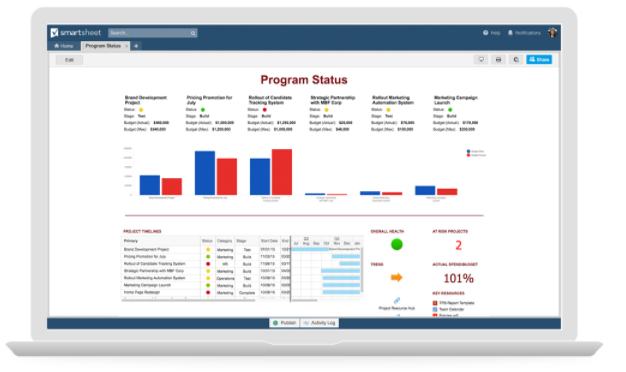
Program managers who use dashboards effortlessly stay on top of their overall program status. They have visibility into every aspect of their project portfolio, from key project metrics and status information, to supporting documentation.
Client Testimonial from Oscar Gonzalez, Manager — Program Planning at Karyopharm Therapeutics who uses dashboards to manage clinical trial programs.
“We are testing new treatments in oncology and other indications in more than 300 hospitals and clinics across more than 20 countries. Maintaining real-time visibility across our trial portfolio is critical to keeping us on track and our executives informed. Smartsheet dashboards allow us to do that and new charts will now allow us to display enrollment projections, so that project teams can see the projections for the coming months.”
Get the Information You Need When You Need It
No matter what your role in an organization, our easily-configurable dashboards give you the right information at the time, so that you know what you need to know to make better decisions without having to track down relevant data.
Here’s a look at how dashboards can help your organization increase visibility into real-time information, spot emerging trends, and quickly act on data — all without help from IT.
For more information on how to add a chart to your dashboard, read our help article.


