


Business Process
Automation Consultants

Smartsheet – How to Use Cell Linking to Create a Master Gantt Chart

Gantt charts are an awesome resource for managing projects as they provide a visual timeline of the progress of each task. But are you checking multiple project sheets and drilling down to all of the details every day? Nobody’s got time for that!
Cell linking to the rescue! Let us show you how to make a “Master” Gantt chart – perfect for rolling together calendars or project schedules.
What is a Gantt chart?
A Gantt Chart is a bar chart that indicates a project’s progress. In this chart format, a series of horizontal lines shows the amount of work done or production completed in certain periods of time in relation to the amount planned for those periods.
In simpler words Gantt charts are a visual view of tasks displayed against time. They represent critical information such as who is assigned to what, duration of tasks, and overlapping activities in a project.
Key features and benefits of Gantt Charts
There are many points to note about the structure and function of a Gantt chart that help a project manager in particular, such as tasks, milestones, task bars, due dates, dependencies and task IDs.
With complicated projects involving multiple players and sub projects to be able to link Gantt Chart cells to real time data feeds helps to automate updates, and keep the project running more efficiently.

Smartsheet Gantt Chart Case Study
One group that has become the master of Masters is the marketing team at Behr. Lisa Kudukis, director of professional products and services, shares one of her Gantt Chart examples.
She uses a Master Dashboard in Smartsheet to keep a handle on her team’s widespread projects. Kudukis left Excel spreadsheets in the dust and is able to keep her team all on the same page, with a holistic project view using Smartsheet Gantt Chart online.
“It’s been a tremendous help for me when I’m reporting to the executive team. I can easily show the task lists that demonstrate my team has thought through every detail for each event,” said Kudukis when she explained her Master Dashboard.
The benefit of cell linking from individual cells
With cell linking, cells from individual sheets with critical data (like status information) are linked to the Behr’s Master Dashboard, and automatically updated whenever a team member makes changes.
The Behr team is saving time, money, and stress with this simplified system. <Read the full case study>
How to create your own Smartsheet Gantt Chart
Here are some steps to create your own Master Dashboard:
1. Create a new project sheet
This will be your “Master” sheet. One of the easiest ways to do this is to click the “Plus” tab at the top of your account and create a new project sheet. This sheet comes pre-loaded with dependency columns and a Gantt chart ready to be filled in.
2. Double-check the order of the columns in your project sheets
Project sheets have certain columns that communicate with their subsequent Gantt charts. Make sure that all of the columns are in the same order in the project sheets you are planning to link to your Master Dashboard.
One thing to note about Predecessor columns: Predecessors indicate task-specified dependencies, so cell linking is not allowed in this column.
3. Start linking cells.
Pretty simple – click on the first cell in your new sheet, and then click the Cell Linking icon in the left toolbar. ![]()
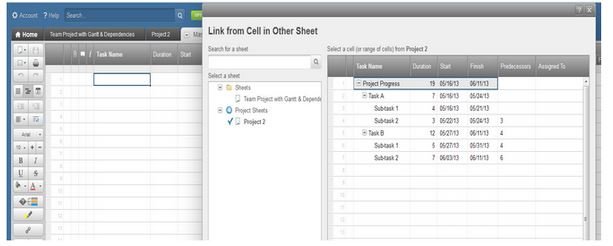
A screen will pop up and display all of your other project sheets. Select one sheet from the left panel to display its content on-screen in the right panel. Just click and drag your mouse around the cells you want to display in your Master Dashboard.
Then click Create Link at the bottom of the form. The cells you select to link from the pop-up screen will appear in the same order in your Master Dashboard.
Rockstar Tip:
Simplify cell linking to your Master Dashboard by taking advantage of parent rows from your project sheets (learn more about parent roll-up functionality).
In this Smartsheet Gantt Chart example, I’m only linking to a single row from my project sheet, because it is a top-level parent row, meaning it gives an overall indication of the entire project’s progress. It’s the only row I’m really interested in seeing from each of my project sheets.
Keeping linking!
Now that you’ve linked your first project sheet to your Master Dashboard, move on to the next one. Remember how convenient it can be to have an online Gantt Chart, linked to data sourdes.
Click on the next empty cell – which in this example is Row 2 – and then click the Cell Linking icon again to pull in data from the next project sheet.
Keep going until you have all of the data from your project sheets reflected in one easy-to-access location.
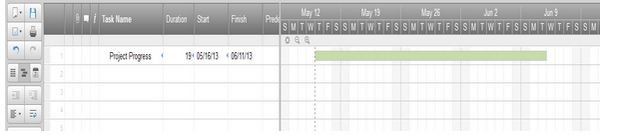
What is displayed in the Gantt Chart?
Information from the rows you’ve linked will be displayed in the Gantt chart, and you can open the Calendar view to see task plotted out in the calendar as well.
See more about our Smartsheet Consultancy to learn about our expertise in Smartsheet.
CONTACT US to make an appointment so we can help you in person, we’d love to hear from you.


